Visibility Graph Grouping
Overview
This example uses a simple obj file included in example models. For context of what the points are showing in the example, the model itself looks like the image displayed below.

First we setup the graph generator as seen in other examples.
import matplotlib.pyplot as plt
from mpl_toolkits.mplot3d import Axes3D

from dhart.geometry import LoadOBJ
from dhart.raytracer import EmbreeBVH
from dhart.graphgenerator import GenerateGraph
from dhart.visibilitygraph import VisibilityGraphAllToAll, VisibilityGraphGroupToGroup
import dhart as hfpy

# Get a sample model path
obj_path = hfpy.get_sample_model("VisibilityTestCases.obj")

# Load the obj file
obj = LoadOBJ(obj_path)

# Create a BVH
bvh = EmbreeBVH(obj, True)

# Set the graph parameters
# Test examples are failing on 1. Seems to be embree failing on edge intersection
start_point = (1.1 , 1.1, 20) #offset X by 60 for each new model
spacing = (1, 1, 5)
max_nodes = 10000
up_step, down_step = 0.1, 0.1
up_slope, down_slope = 1, 1
max_step_connections = 1

# Generate the Graph
graph = GenerateGraph(bvh, start_point, spacing, max_nodes,
                        up_step,up_slope,down_step,down_slope,
                        max_step_connections, cores=-1)
After the graph is generated, we pull out the nodes to use for visibility checks. First we claculate the AllToAll method that is compared later to the same groups.
# Get the nodes of the graph as a list of x,y,z,type,id tuples
nodes = graph.getNodes()
print(len(nodes))
height = 1.7 # Set a height offset to cast rays from the points
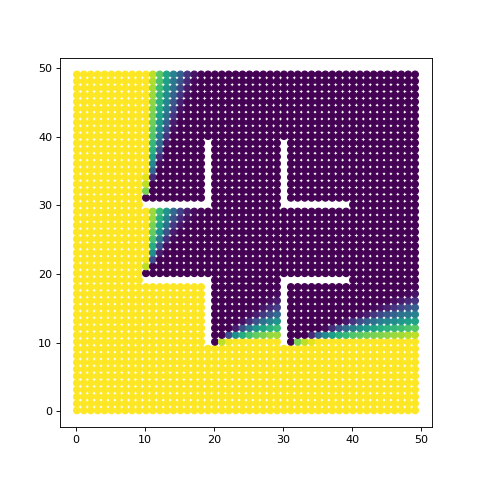
VG = VisibilityGraphAllToAll(bvh, nodes, height) # Calculate the visibility graph
visibility_graph = VG.CompressToCSR() # Convert to a CSR (matrix)
scores = VG.AggregateEdgeCosts(2, True) # Aggregate the visibility graph scores
# Plot the graph using visibility graph as the colors
fig = plt.figure(figsize=(6,6))
plt.scatter(nodes['x'], nodes['y'], c=scores)
plt.show()
In the above, we use the all to all method of the graph. This is equal to using two groups that are both the graph.
VG = VisibilityGraphGroupToGroup(bvh, nodes, nodes, height) # Calculate the visibility graph
visibility_graph = VG.CompressToCSR() # Convert to a CSR (matrix)
scores = VG.AggregateEdgeCosts(2, True) # Aggregate the visibility graph scores

# Plot the graph using visibility graph as the colors
fig = plt.figure(figsize=(6,6))
plt.scatter(nodes['x'], nodes['y'], c=scores)
plt.show()

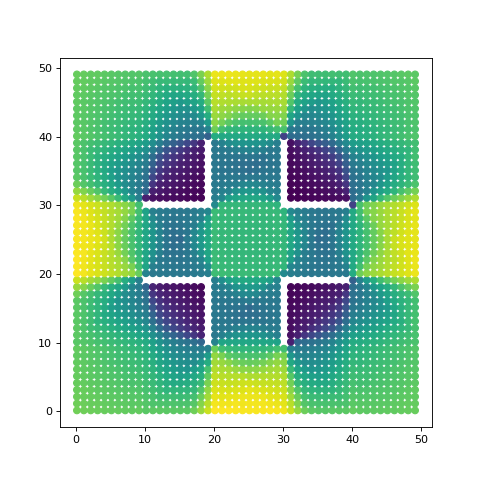
Next we can check a single point and how it compares. In this case, we want to get the score for all of the nodes that connect TO a point. For clarity, we visualize this as just the number of edge connections, which when given a single point, will be either 0 or 1.
VG = VisibilityGraphGroupToGroup(bvh, nodes, [nodes[0]], height) # Calculate the visibility graph
visibility_graph = VG.CompressToCSR() # Convert to a CSR (matrix)
scores = VG.AggregateEdgeCosts(2, True) # Aggregate the visibility graph scores

# Plot the graph using visibility graph as the colors
fig = plt.figure(figsize=(6,6))
plt.scatter(nodes['x'], nodes['y'], c=scores)
plt.show()
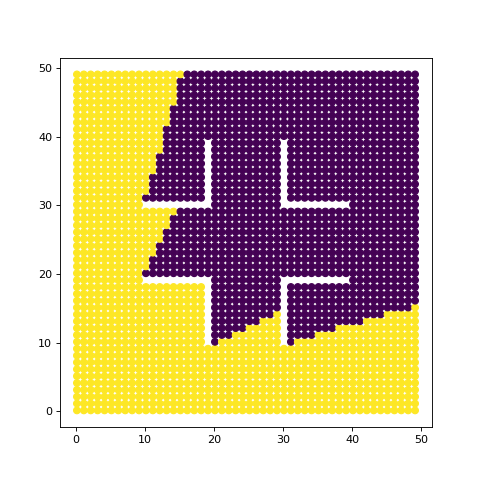
We repeat this process, but now including the first 100 nodes. This is approx. the bottom left 10x10 square.
VG = VisibilityGraphGroupToGroup(bvh, nodes, nodes[0:100], height) # Calculate the visibility graph
visibility_graph = VG.CompressToCSR() # Convert to a CSR (matrix)
scores = VG.AggregateEdgeCosts(2, True) # Aggregate the visibility graph scores

# Plot the graph using visibility graph as the colors
fig = plt.figure(figsize=(6,6))
plt.scatter(nodes['x'], nodes['y'], c=scores)
plt.show()