Visualize a Visbility Graph Connections
Overview
This example uses a simple obj file included in example models. For context of what the points are showing in the example, the model itself looks like the image displayed below.

import matplotlib.pyplot as plt
from mpl_toolkits.mplot3d import Axes3D

from dhart.geometry import LoadOBJ
from dhart.raytracer import EmbreeBVH
from dhart.graphgenerator import GenerateGraph
from dhart.visibilitygraph import VisibilityGraphAllToAll
import dhart as hfpy

# Get a sample model path
obj_path = hfpy.get_sample_model("VisibilityTestCases.obj")

# Load the obj file
obj = LoadOBJ(obj_path)

# Create a BVH
bvh = EmbreeBVH(obj, True)

# Set the graph parameters
# Test examples are failing on 1. Seems to be embree failing on edge intersection
start_point = (1.1 , 1.1, 20) #offset X by 60 for each new model
spacing = (1, 1, 5)
max_nodes = 10000
up_step, down_step = 0.1, 0.1
up_slope, down_slope = 1, 1
max_step_connections = 1

# Generate the Graph
graph = GenerateGraph(bvh, start_point, spacing, max_nodes,
                        up_step,up_slope,down_step,down_slope,
                        max_step_connections, cores=-1)

# Convert the graph to a CSR
csr_graph = graph.CompressToCSR()

# Get the nodes of the graph as a list of x,y,z,type,id tuples
nodes = graph.getNodes()
print(len(nodes))

height = 1.7 # Set a height offset to cast rays from the points
points = graph.get_node_points() # Define points as the graph nodes
VG = VisibilityGraphAllToAll(bvh, points, height) # Calculate the visibility graph
visibility_graph = VG.CompressToCSR() # Convert to a CSR (matrix)
scores = VG.AggregateEdgeCosts(2, True) # Aggregate the visibility graph scores

# Plot the graph using visibility graph as the colors
fig = plt.figure(figsize=(6,6))
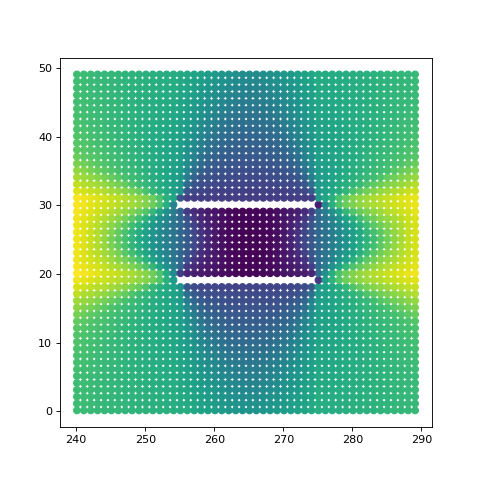
plt.scatter(nodes['x'], nodes['y'], c=scores)
plt.show()
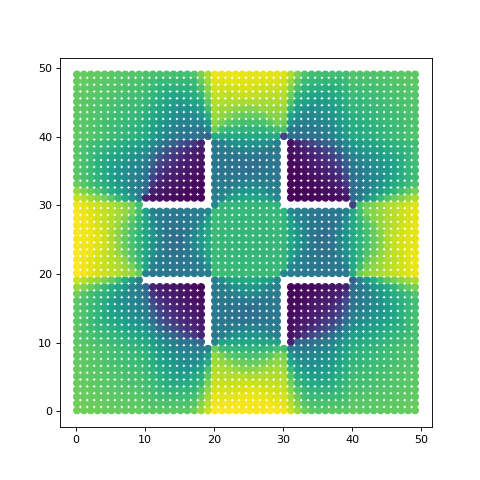
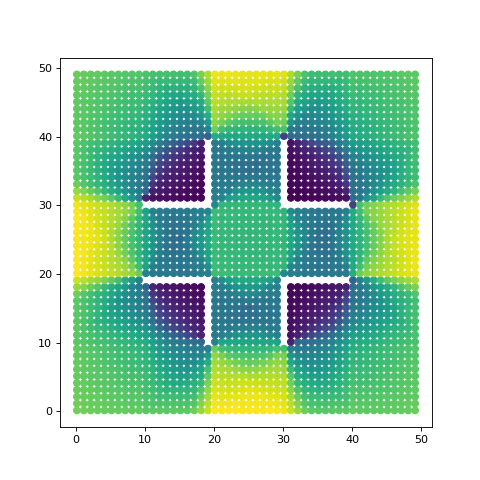
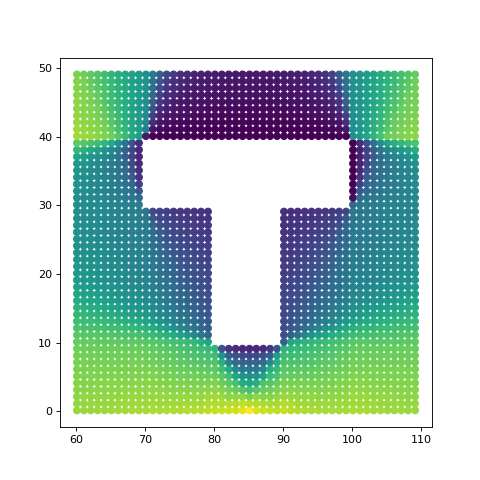
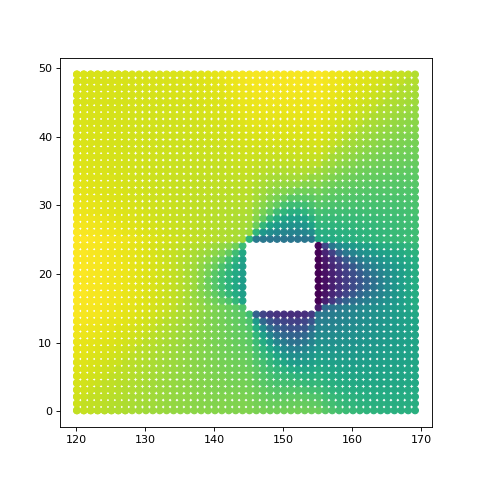
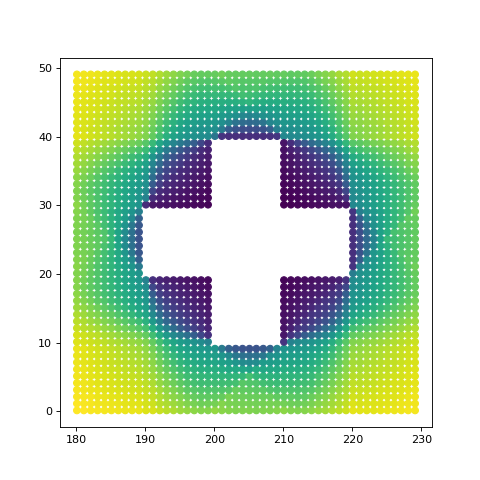
We can see all of the example cases in the test file by regenerating the graph by our known model offset
for i in range(5):

    # Set the graph parameters
    # Test examples are failing on 1. Seems to be embree failing on edge intersection
    start_point = (1.1 + (60*i) , 1.1, 20) #offset X by 60 for each new model

    # Generate the Graph
    graph = GenerateGraph(bvh, start_point, spacing, max_nodes,
                            up_step,up_slope,down_step,down_slope,
                            max_step_connections, cores=-1)

    # Convert the graph to a CSR
    csr_graph = graph.CompressToCSR()

    # Get the nodes of the graph as a list of x,y,z,type,id tuples
    nodes = graph.getNodes()

    height = 1.7 # Set a height offset to cast rays from the points
    points = graph.get_node_points() # Define points as the graph nodes
    VG = VisibilityGraphAllToAll(bvh, points, height) # Calculate the visibility graph
    visibility_graph = VG.CompressToCSR() # Convert to a CSR (matrix)
    scores = VG.AggregateEdgeCosts(2, True)

    # Plot the graph using visibility graph as the colors
    fig = plt.figure(figsize=(6,6))
    plt.scatter(nodes['x'], nodes['y'], c=scores)
    plt.show()
